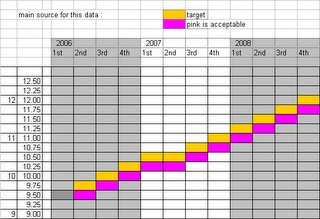
One of the key questions regarding peak-oil is how much longer Saudi Arabia can continue to expand its spare capacity. The plan agreed to by Bush and Abdullah in the Spring of 2005 was that the Saudis would expand their production to 12 million barrels per day by 2008. I have interpreted this to mean the end of 2008. Daniel Yergin has stated that they are on track to meet this goal by "2009," in his latest article in the Times Online.
The chart above shows what I believe should be the quarterly goals in orange, an acceptable level of a quarter-million barrels per day in pink below this, and actual attained production in dark grey.
We should be able to tell from updates to this chart if we're in trouble or not.